Executive Summary
Sales conversion and cart abandonment are a challenge across all channels and industries, including financial services. Abandonment at different stages in the banking sales funnel, for example, is estimated to range between 67% and 80%, which highlights the potential value destroyed by clients leaving the onboarding journey.
Getting the onboarding journey right is critical, as onboarding is often the first touchpoint that shapes a customer’s initial impressions of a bank. As such, it might influence their long-term satisfaction and loyalty, as well as impact future cross-selling opportunities.
Based on this understanding, Arkwright and Arkwright Digital completed a study of nearly 200 onboarding journeys of retail current account openings and credit card applications at European banks, evaluating current performance as well as identifying trends and potential optimization, highlighting best practices and room for improvement in the field.
Overall, there is significant value left behind by suboptimal onboarding journeys. Fig. 1 provides an illustration of the potential improvement rates that the Arkwright team observed with five different optimization interventions.
Based on our experience of helping organizations improve their digital onboarding effectiveness in more than 25 countries, there is empirical evidence that well-designed onboarding experiences ensure smooth and efficient journeys for customers, by reducing frustration and removing barriers to completion. Thereby, maximizing the chances of a customer completing the process and leading to meaningful business results.
2.0 Introduction
Sales conversion and cart abandonment are a challenge in every industry and across all channels, whether online or in person.
Let’s take, for example, the retail industry. Despite the growth of e-commerce, in-store purchases still represent about 80% of total sales on average. However, this is good news for the industry because, based on statistics, the average retail online conversion rate is about 2%-3%, while the average conversion rate ranges between 20%-40% in-store. Undoubtedly, e-commerce will continue to gain a larger share of sales, especially in retail financial services where embedded finance and the shift to mobile banking, as well as the imperative to cut costs, are driving a reduction in branch networks.
As the financial industry increasingly markets core services online and integrates services into third-party channels, online cart abandonment becomes a major sales challenge. Finance ranks second in abandonment rates, as shown in Fig. 2.

2.1. Digital onboarding benchmarking approach and methodology
During Q2 and Q4 2023, Arkwright investigated and scored a sample of 198 online current account and credit card application processes from a sample of banks and neobanks. The sample is distributed across five European countries – Germany, Italy, Poland, Spain and the United Kingdom – and one region, comprising the Nordic countries, as illustrated in Fig. 3.

ARKWRIGHT INVESTIGATED AND SCORED A SAMPLE OF 198 ONLINE CURRENT ACCOUNT AND CREDIT CARD APPLICATION PROCESSES
The evaluation and comparison have been based on more than 62 criteria across five main digital onboarding features:
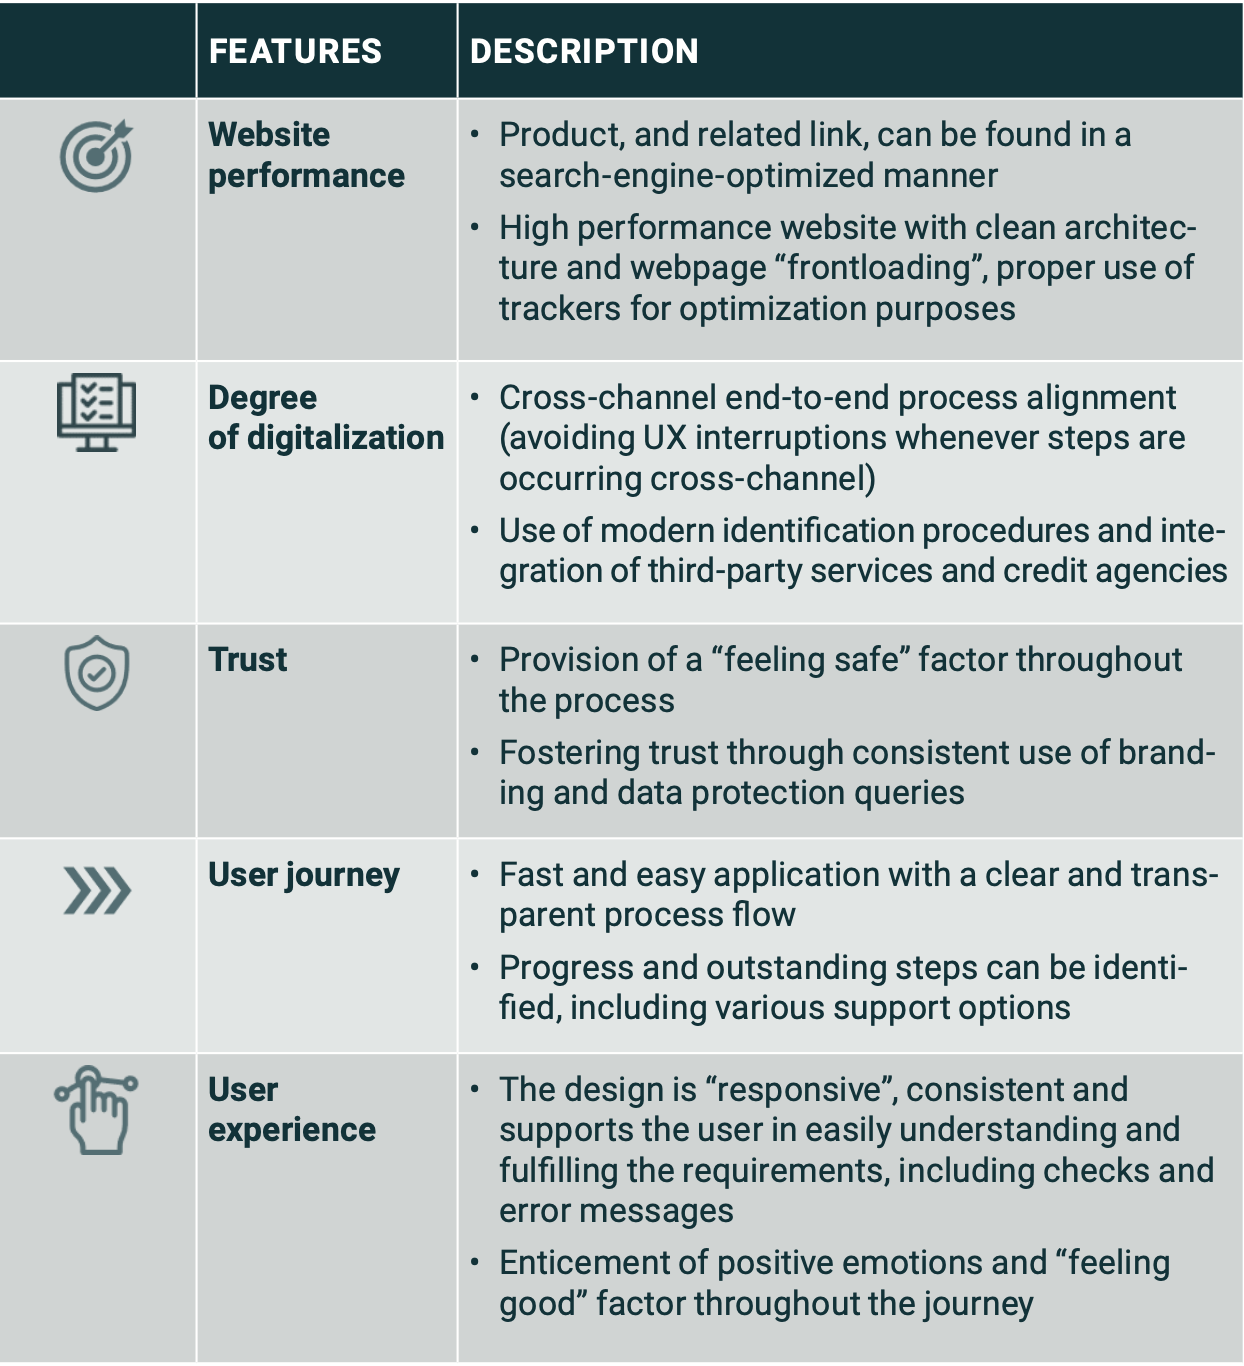
The scoring is based on empirical experience of a specialist digital onboarding team of consultants applying for products and analyzing the onboarding process. This was done in scoring teams to minimize any discretionary scoring risk. It is based on a comprehensive scoring reference guide and includes the actual user onboarding journey experience, analysis of the bank website and related technical characteristics.
The teams, tasks, and overall research approach have been designed in a way to ensure scoring and interpretation consistency, as well as minimize discretionary errors.
3.0 ONBOARDING EXPERIENCE RESULTS
Overall, the benchmarking exercise highlighted two main findings: pervasive inconsistencies across all analyzed categories; and different fulfillment levels across countries. The Arkwright team identified relative best practice references by category among the analyzed onboarding journeys.
3.1. Pervasive inconsistency
The research found that there is a significant variance across all criteria in every country in the sample. However, user journey and UX scores illustrate a higher convergence compared to that of the other three features groups. Fig. 4 provides an illustration of the score distribution across the five featured criteria (otherwise referred to as scoring parameters).
The findings highlight room for improvement in every category. This is particularly true in the user journey area, which records the lowest top score and only around 50% on average. UX, on the other hand, is the criteria with the highest average score of 71%.

User journey and UX scores have compressed distribution ranges, which indicate a possible area of convergence on which banks are concentrating on. This could be explained by banks’ initial focus on UX, which has recently been enhanced with further digitalization attempts within the user journey itself.
For example, banks are now gathering much more data and relevant documents throughout the onboarding journey, as well as improving the process flow (minimized clicks per journey, chatbot support,simple navigation).
3.2. Common themes by country
Overall, despite significant national variances, some markets appear to offer, on average, better onboarding experiences than others. Inter-estingly, the research found a correlation between a country’s degree of digitalization and its performance score.
Fig. 5 illustrates how countries’ scores of digitalization and the average digital onboarding performance of each country’s banks and card issuers appear to correlate.

PERFORMANCE AND CHARACTERISTICS OF ONBOARDING PROCESSES DIFFER BETWEEN CREDIT CARD APPLICATIONS AND ACCOUNT OPENINGS, EVEN WITHIN BANKS. IN ADDITION,DIFFERENCES BETWEEN COUNTRIES WERE PRESENT
Yet this hypothesis does not hold true in all cases. It is interesting to note that some countries, despite having a high degree of digitization, may exhibit a low onboarding score. Hence, a high level of digitalization doesn't necessarily indicate good onboarding journeys. Interestingly, Nordic countries – which are known for their high degree of digitalization – tend to achieve higher overall scores in onboarding journeys. Spain and Germany fall within the average range, while the UK and Italy exhibit lower onboarding ratings, despite having relatively higher rates of digitalization.
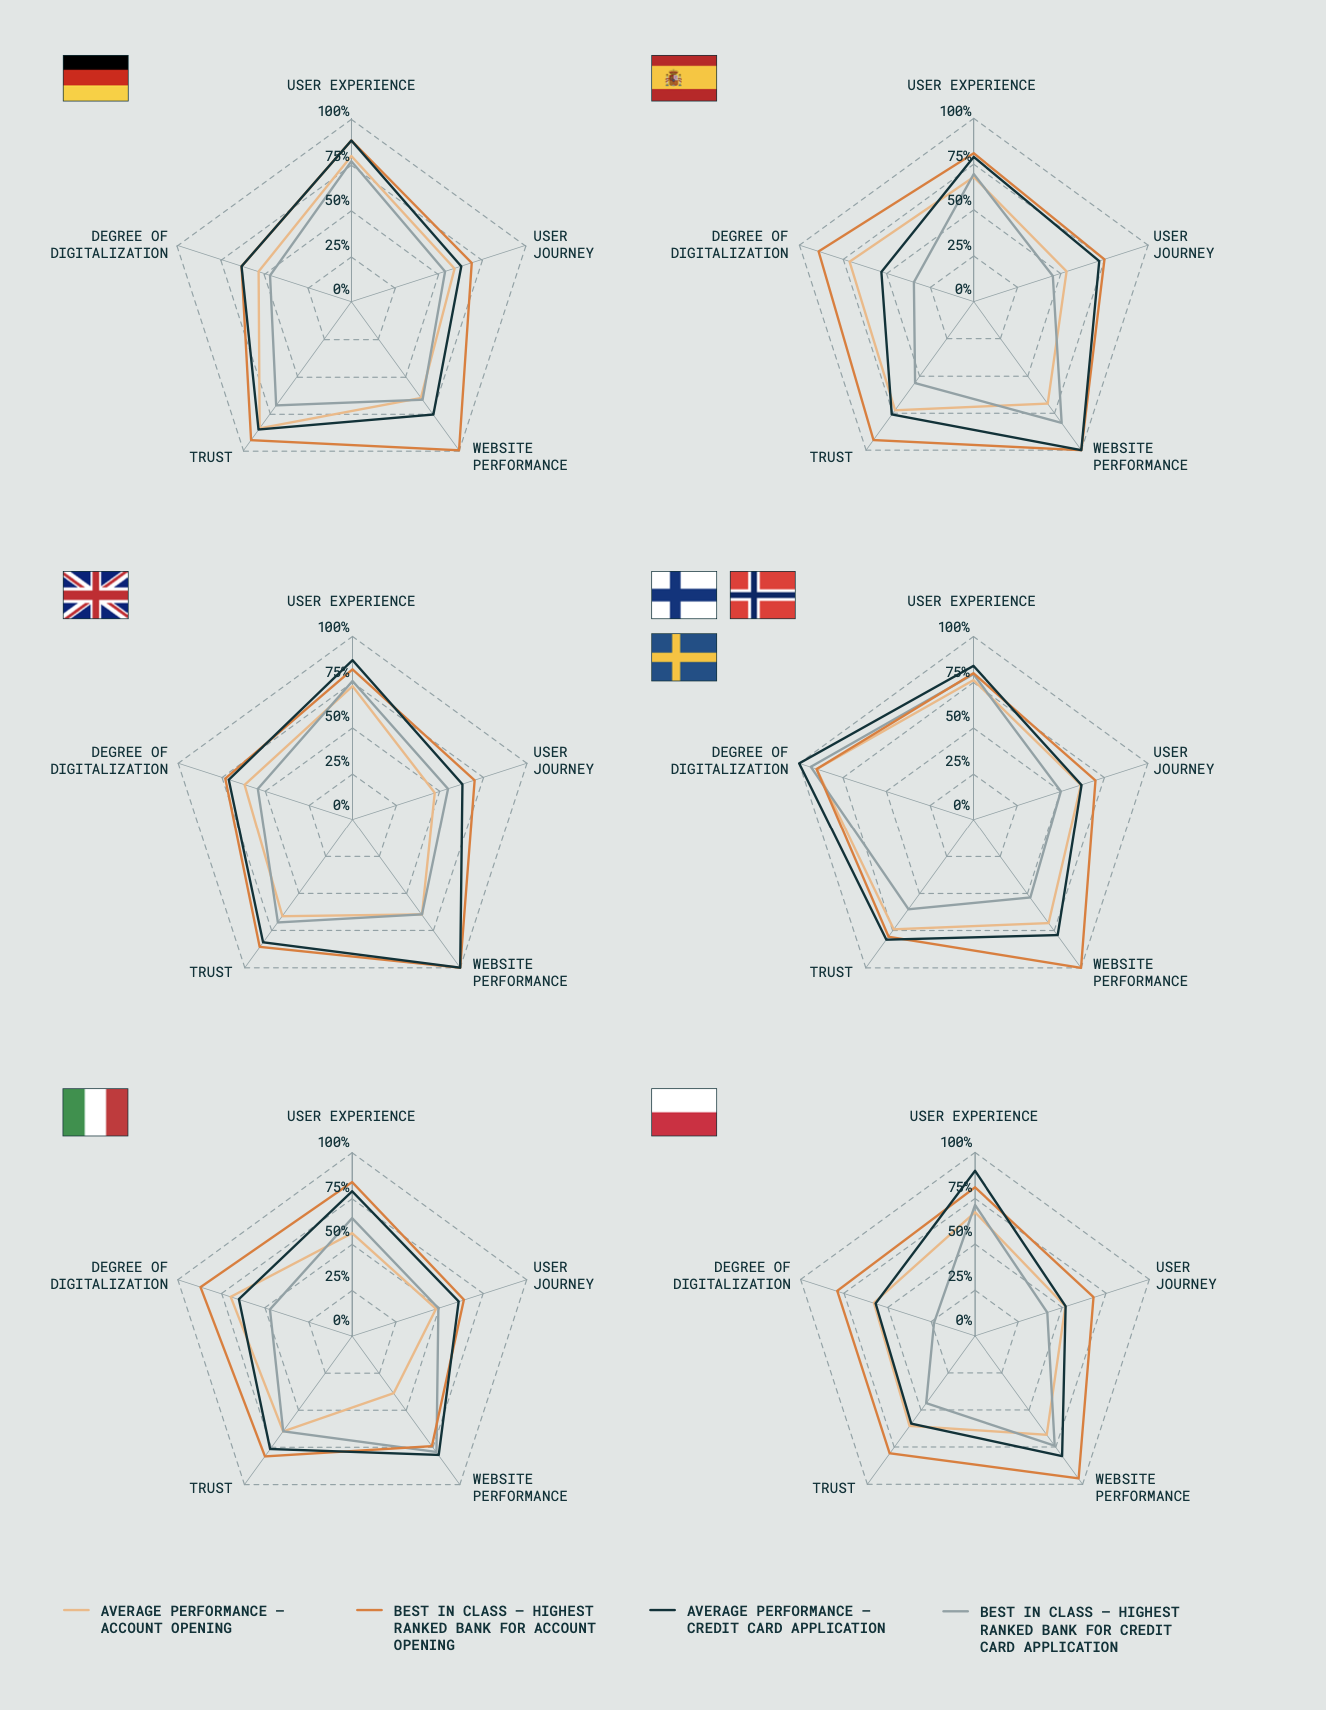
The performance and characteristics of onboarding processes differ between credit card applications and account openings, even within banks, in addition to differences between countries (an overview of the different average scores for credit card applications, account openings, and total scores by country and category can be found in Fig. A1 in Appendix 2). For example, Nordic banks excel in both account opening and credit card applications, securing the top overall rating in the cohort. Meanwhile, Italy and Poland rank lowest in both categories. While the overall scores provide an indication of the average stage of evolution of the digital onboarding practices in each country, there are some interesting points to be noted. For example, in each country there are relative best performers in each scoring category. An illustration of these relative best performances in digital onboarding is illustrated in Fig. 6.
While organizations in the Nordics are emerging as leaders in this space, all organizations in the sample have some potential for improvement. Across Finland, Sweden, and Denmark, for example, the research found distinct performance variations across account openings and credit card journeys in different categories – namely user journey, trust, and website performance – despite showing comparable patterns. Generally, the spider-web diagrams show similar shapes for Germany, Italy, Poland, Spain, and the UK. In Germany, current account digital onboarding consistently performs better than credit card applications and, comparatively, shows better performance in the trust and UX criteria. German financial institutions illustrate a particular emphasis on providing a relatively better UX and clearer communication of legal information.
3.3. Inconsistencies across products and selection of detailed metrics
When comparing the performance and characteristics of the onboarding journeys across products – current accounts and credit cards – the research found that these can vary even within the same bank. Fig. 7 to 11 provide an overview of the range (min.-max.) and average values for both account openings and credit card applications across individual countries. In addition, some best practices gleaned from the top 10 organizations in their respective categories are listed.
Website Performance
Superior website performance with fast loading times and a well-structured user interface plays a crucial role in the application process. Efficient navigation and short loading times promote user satisfaction and reduce potential abandonment. Additionally, compatibility with different browsers is essential to reach a broad user base.Overall, top-notch website performance emphasizes the importance of a smooth online experience in the sales journey. While several countries have individual top performers who score 100%, the average values and wide ranges vary from country to country.

User Journey
An efficient application process requires a first-class user journey. This includes a simplified process, intuitive navigation, comprehensive user support, and clear information on requirements and progress. Special attention is paid to learning from the UX space by minimizing unnecessary information requests, visualizing progress, and designing a logical flow. These measures are critical for a smooth registration process and strengthen user confidence in the long term.
The min.-max. ranges are mainly narrower than in the website performance criterion, with larger variances found in Italy, Spain, and the UK. The average values move in a similar range of 20%, between 42% and 62%.

User Experience
The quality of the UX in the bank application process is emphasized by several decisive factors. For example, a responsive web design enables seamless use on different devices. Tooltips, inline validation, and clear input help to minimize errors. A consistent, mobile-friendly design, and the integration of error prevention tools increase user satisfaction. Easy-to-understand error messages also help to ensure a smooth overall experience.
Most countries perform similarly in comparison with average values of 67% to 80%, except for Italy, which records a poorer performance in this area.

Trust
Building trust in the bank onboarding process is strengthened by key elements such as a consistent URL structure, effective branding, and transparent conditions. Clear communication of the legal basis and the transfer of brand identity throughout the entire process are key aspects for creating a trustworthy environment.
Optimized placement and presentation of terms and conditions, as well as clear explanations for requesting information, are key factors in gaining the trust of users. Banks in Germany are among the best performers in this area, followed by Spanish banks.

Degree of digitalization
Digitalization in the bank registration process includes a digital identification process via video or electronic identity (eID), as well as options for document upload and address search. An important learning is the integration of various options for online identification to cover a broad user base.
API integrations, such as optical character recognition (OCR), also play a key role in reducing manual input and thus increasing efficiency in the process. Financial institutions in the Nordic countries consistently demonstrate the use of best practices and noteworthy achievements in this category. That said, some Spanish organizations do not lag far behind.

3.4. Relative best practices example
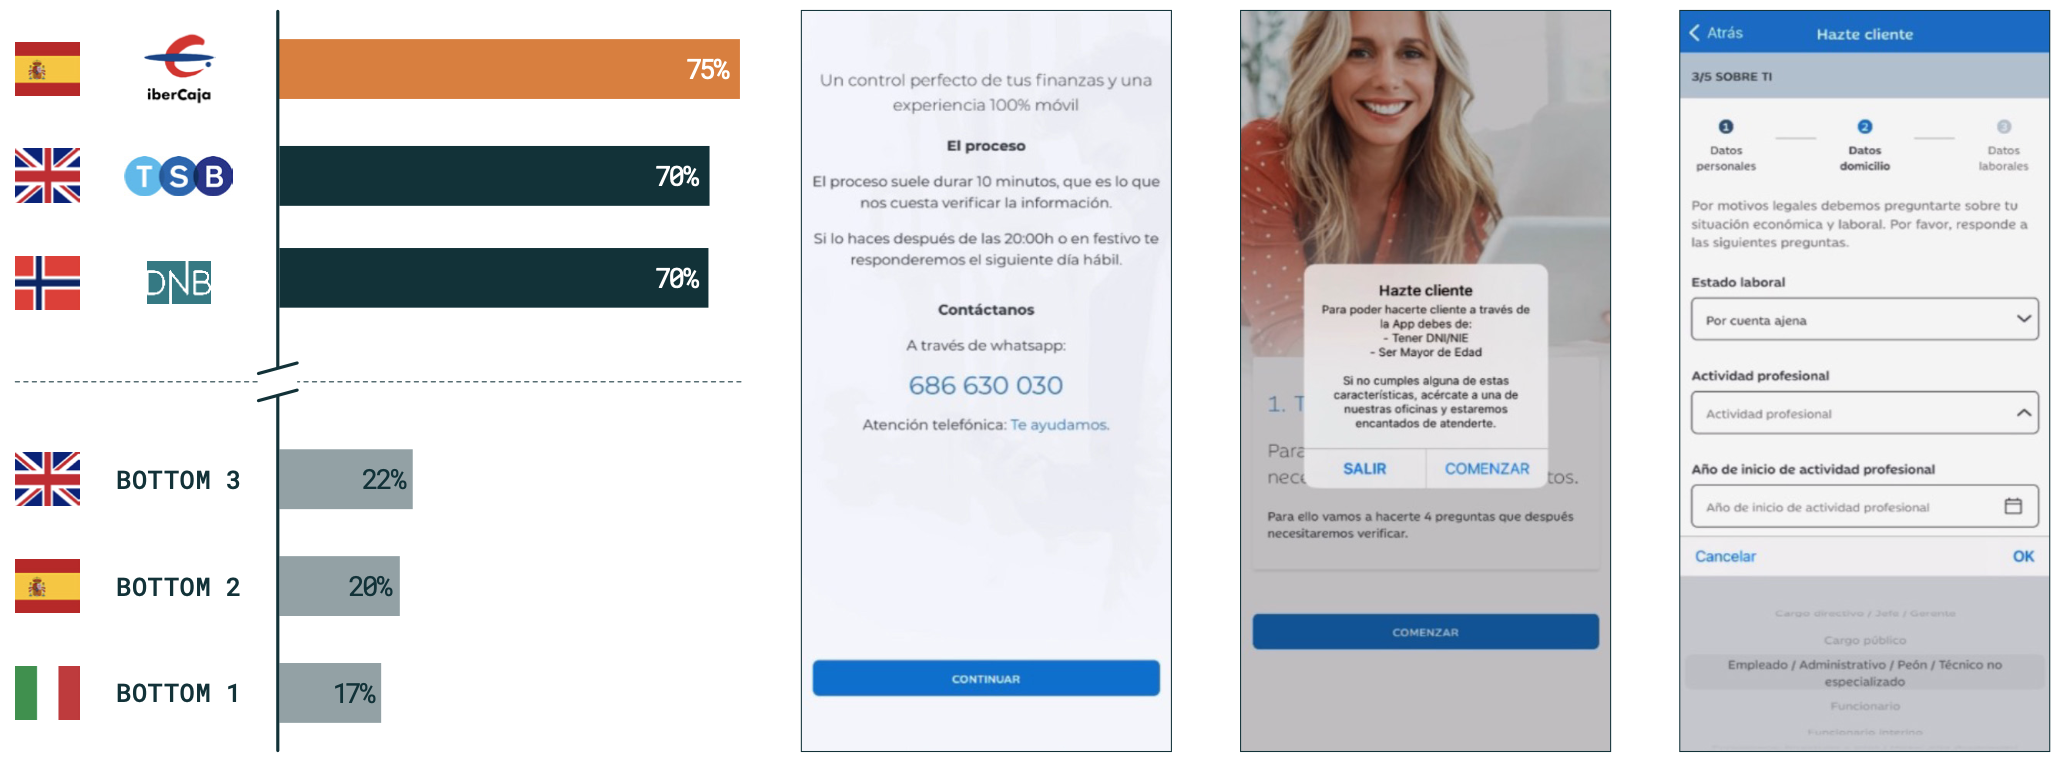
While no bank was found to be the absolute best in class across all scoring criteria, the research highlighted several interesting sets of relative best practice references. Fig. 12 provides insight into best practices for the user journey category with exemplary screenshots.
In the benchmarking analysis, Spain’s Ibercaja emerged as the frontrunner in the user journey space, scoring 75%. It has a highly navigable application process, providing users with a clear and intuitive experience. The deliberate emphasis on simplicity and intuitive navigation elevates the overall UX significantly.
Other top performers also excel in this aspect. However, there remains potential for improvement in process flow and user support to maximize the overall user journey. This underscores that, despite the attained success, there is still room for further optimization.
4.0 CONCLUSIONS AND WORKING HYPOTHESIS
4.1. Widespread potential for improvement
Based on Arkwright’s experience and benchmarking results, the working hypothesis imposes that there are several potential areas of improvement identified across the markets in question.
One of the key learnings, across all metrics, is that there is a significant variance even among banks in the same market. This implies that banks in all countries have the potential to improve their onboarding journey compared to their direct competition.
Potential for optimization ranges from increasing conversion rates, improving data quality, and reducing process costs. Our research has led to the identification of nine areas, among all categories and sub-category metrics, that have the highest overall potential for improvement across all markets, as illustrated in Fig. 13.
The implementation of effective strategies in banking application processes varies across countries. Categories such as "user support", "idle session timeout", and use of "emotional imagery and animations" consistently show subpar performance across countries, with few exceptions showcasing best practices. This indicates a pressing need for improvement.
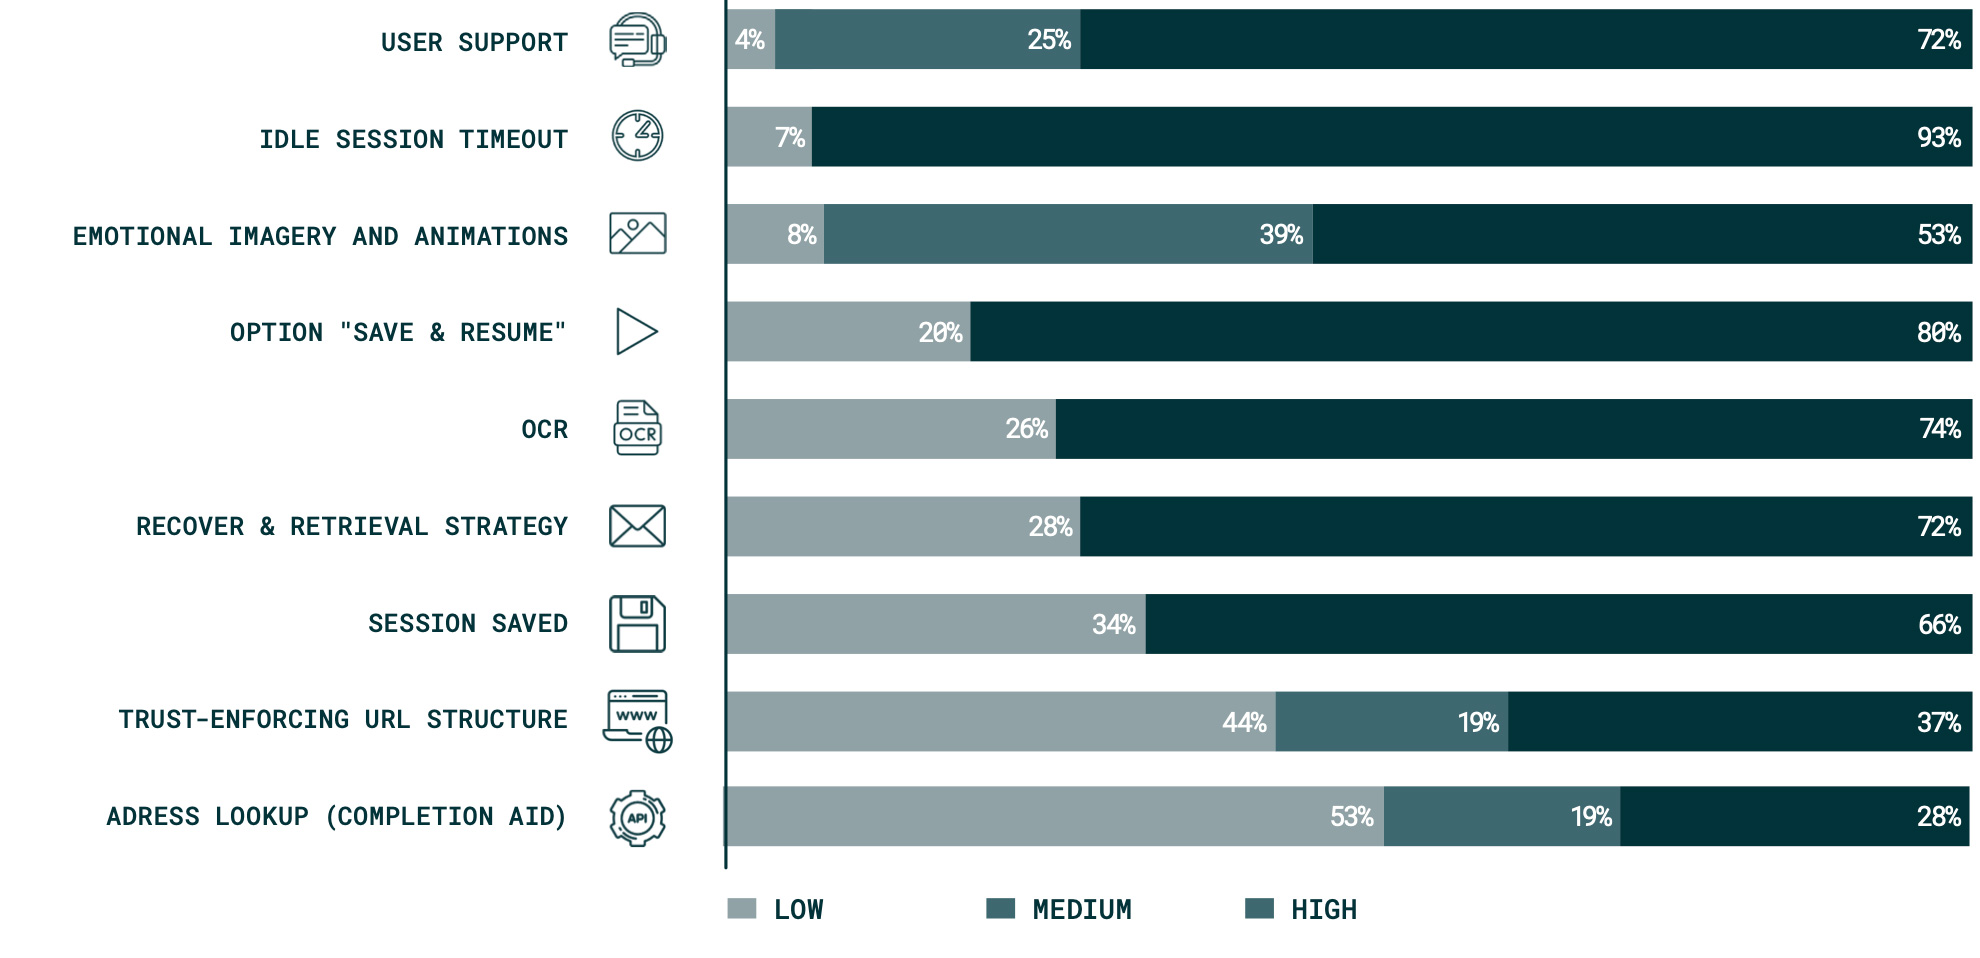
In the case of OCR, Nordic institutions demonstrate low potential for improvement, indicating already effective processes, while the UK banks show high potential. "Save & resume" options are currently best integrated in Italy and Spain, with some room for further improvement.
In "recover & retrieval communication strategy", Spanish banks have the lowest potential for improvement, suggesting the best strategies so far, while German banks show high potential for improvement. The not yet widespread use of "session saved" across most processes highlights the significant potential for improvement across all countries. Furthermore, there is considerable room for improvement in the areas of "address lookup" and "trust-enforcing URL structure".
Assessing categories based on implementation effort and impact on conversion rate, as illustrated in Fig. 14, reveals quick wins in "trust-enforcing URL", "session saved", and "option save & resume", as their implementation is straightforward. While functionalities like "user support" and "prefill APIs" demand substantial effort reflected in development and costs, their positive impact on UX makes them worthwhile investments to streamline interactions and enhance overall satisfaction.
In contrast, there are categories that can have a negative impact on UX. Drawing from Arkwright Digital’s project experience, it’s evident that incorporating excessively lengthy sections in the terms and conditions (T&Cs) during the onboarding process, or the extensive gathering of user data at the front end, yields little value for the user despite demanding substantial implementation effort. Consequently, prioritizing these types of time-consuming elements should be avoided.

4.2. The potential of an optimized digital onboarding process
Digital onboarding is, de facto, the actual checkout process for any financial institution marketing its products through online channels. E-commerce and mobile commerce have expanded the ability to reach wider audiences, as well as leverage third-party channels through embedded finance and as-a-service value propositions. However, online channels have also diluted the control that banks have on their ability to complete the sales cycle.
In our experience, this does not necessitate a reconsideration of the overall channel mix. Instead, banks should focus on utilizing available levers to reduce friction in the onboarding process and maximize the probability of completing the purchase process.
While the levers vary slightly between a business-to-consumer process (e.g., retail banking onboarding consumers) and a business-to-business (B2B) process (e.g., merchant acquiring onboarding micro-merchants), the potential improvement is significant. The applicability extends throughout retail and small and medium-sized enterprise banking, as well as merchant acquiring and insurance.
In Arkwright’s experience in supporting organizations across over 25 countries, we have seen conversion rates improving by nearly 400%.

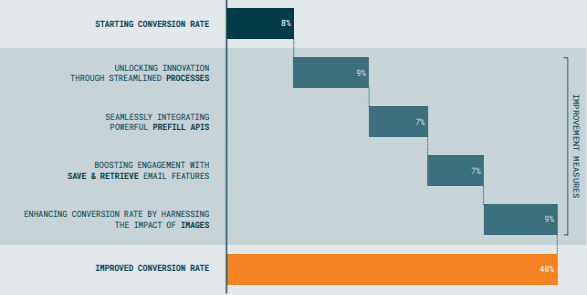
In one example, Arkwright was able to elevate the conversion rate starting from a baseline of 8% throughout various steps to nearly 40% using A/B tests and iterative implementation of improvements in an onboarding journey. The A/B test results indicate that, aside from the implementation of features such as prefill APIs or email features, the integration of business-related images in B2B-onboarding journeys positively influences the conversion rate, as shown in Fig. 15.
Different implementation measures and their potential impact on the conversion rate are illustrated in Fig. 16. The potential improvement in terms of conversion rate is significant. Research on a statistically meaningful sample of onboarding processes has highlighted a universal potential for improvement. An optimized digital onboarding process is not only driving better conversion rates but can be a source of competitive advantage and differentiation.
